

The Curious Case of Croatian Car Codes
A few days ago, I was stuck in a very bad traffic jam, and as I was starting to get quite bored with looking at the slowly-moving cars in front of me, I began thinking about the Croatian license plate system. You see, Croatian cars, motorcycles, and other vehicles typically have a license plate in the format of a two-letter town code, followed by three or four digits, followed by one or two letters. Besides the typical license plates, you can also pay for a custom license plate, but that’s another topic.
Typical license plates
There are ten digits and 22 letters available for the license plate (30 letters in the Croatian alphabet, minus Č, Ć, Dž, Đ, Lj, Nj, Š, Ž), so we can calculate how many combinations there are:
- 3 digits and one letter ->
- 4 digits and one letter ->
- 3 digits and two letters ->
- 4 digits and two letters ->
So in total, there are available typical license plates for each town code. Although there are a 128 towns in Croatia, there are only 34 license plate town codes, so there is total possible license plates.

Zagreb, Split, Pula
What I noticed, though, during the longest 6-kilometer drive of my life, is that some towns are still using three digits, and some have already moved to four. For example, Zagreb (ZG) has been using the 4-digit plates for quite some time now, and Split (ST) and Pula (PU) have started using them only recently. After going through this chain of thoughts, I had questions:
- What is the largest town without a dedicated town code?
- What is the smallest town with a dedicated town code?
- Which license plate covers the largest/smallest population?
- And many more…
Gathering the data
Obviously, when I finally came home a few hours later, I picked up a license plate to town/municipality table from this Wikipedia article, cleaned it up a bit with some Python code, added a few missing entries, and I had something like this:
{
  "VT": {
    "mainTown": "Virovitica",
    "towns": ["Virovitica"],
    "municipalities": [
      "Gradina",
      "Lukač",
      "Pitomača",
      "Suhopolje",
      "Špišić Bukovica"
    ]
  }
}
The other step was to gain the latest census data. Luckily, the Croatian Bureau of Statistics got me covered. I extracted the data, cleaned it up manually so the names match (e.g., some towns and municipalities in Istria have both the Croatian and Italian names in the census, and only the Croatian name in the license plate data), and converted it to a format like this:
{
  "Šibenik": {
    "county": "Šibenik-Knin",
    "unit_type": "Town",
    "total_population": 42599
  },
  "Vodice": {
    "county": "Šibenik-Knin",
    "unit_type": "Town",
    "total_population": 8649
  },
  "Bilice": {
    "county": "Šibenik-Knin",
    "unit_type": "Municipality",
    "total_population": 2546
  }
}
Note: Since there are a few towns and municipalities with the same names, I added a county abbreviation to those names so the names would become unique. For example, Sveta Nedelja - IS for the municipality in Istria, and Sveta Nedelja - ZG for the town in the Zagreb county.
Cool statistics
Now all I needed were a few scripts, and I could answer my questions!
Largest towns without a town code
By taking the population of all towns that are not the main town, I answered my first question:
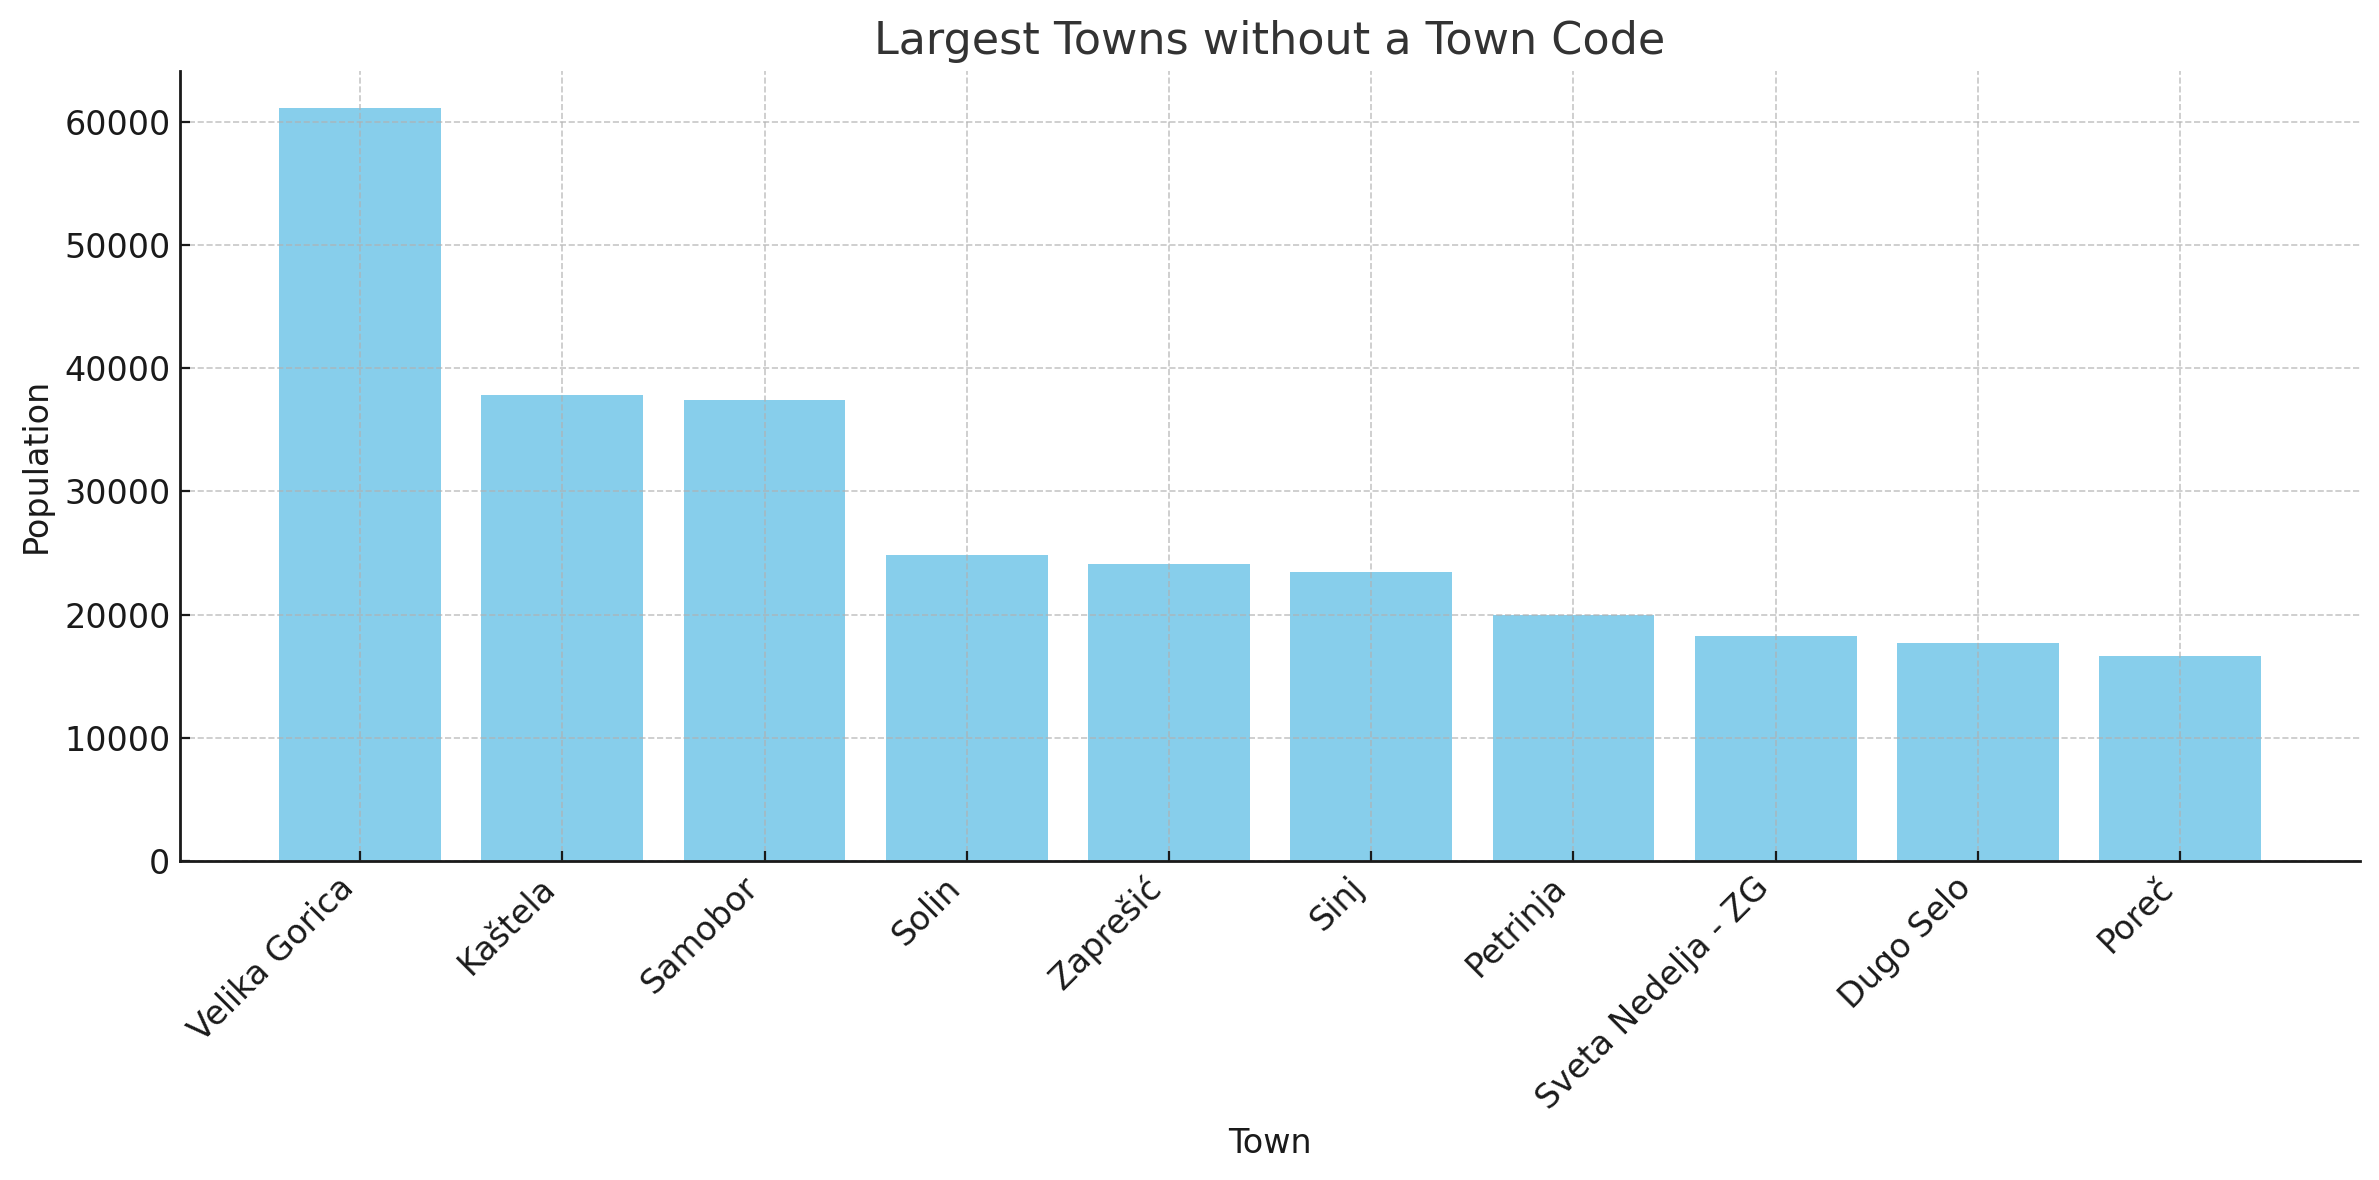
As we can see, Velika Gorica takes the lead with 61,075, followed by Kaštela (37,794), Samobor (37,435), Solin (24,862), and Zaprešić (24,133).
Smallest towns with a town code
By taking the population of all main towns, I answered the second question:
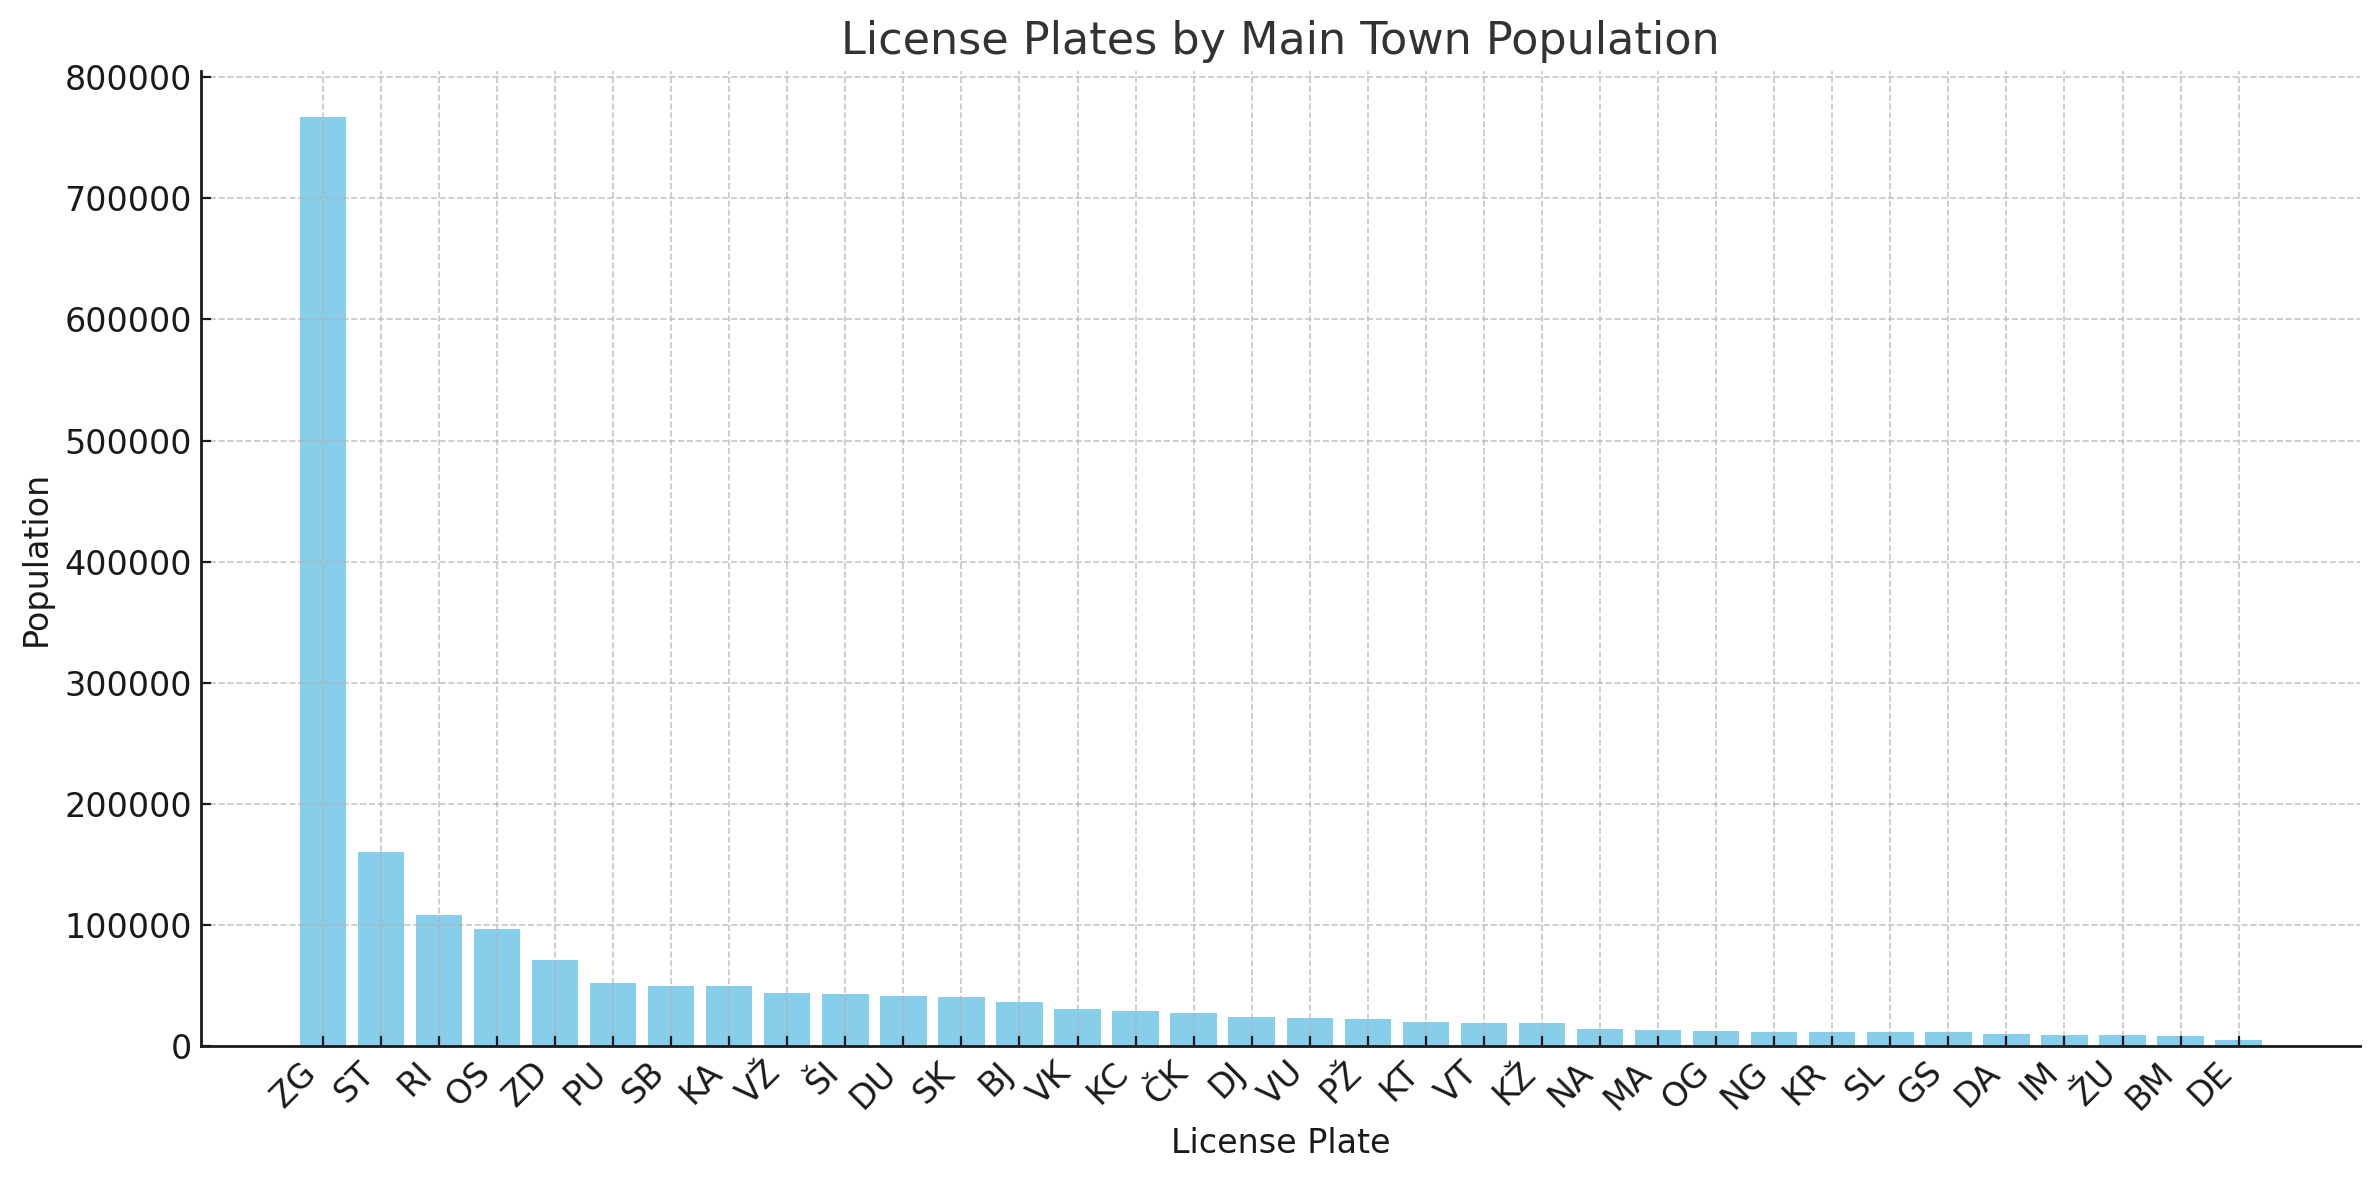
This chart tells us that Delnice is the smallest main town with just 5,135 people, followed by Beli Manastir (7,973), Županja (9,153), Imotski (9,153), and Daruvar (10,105). Interestingly enough, we also found out that Županja and Imotski have the same population.
License plate population coverage
By taking the sum of populations of all towns and municipalities belonging to a specific license plate town code, I answered the third question:
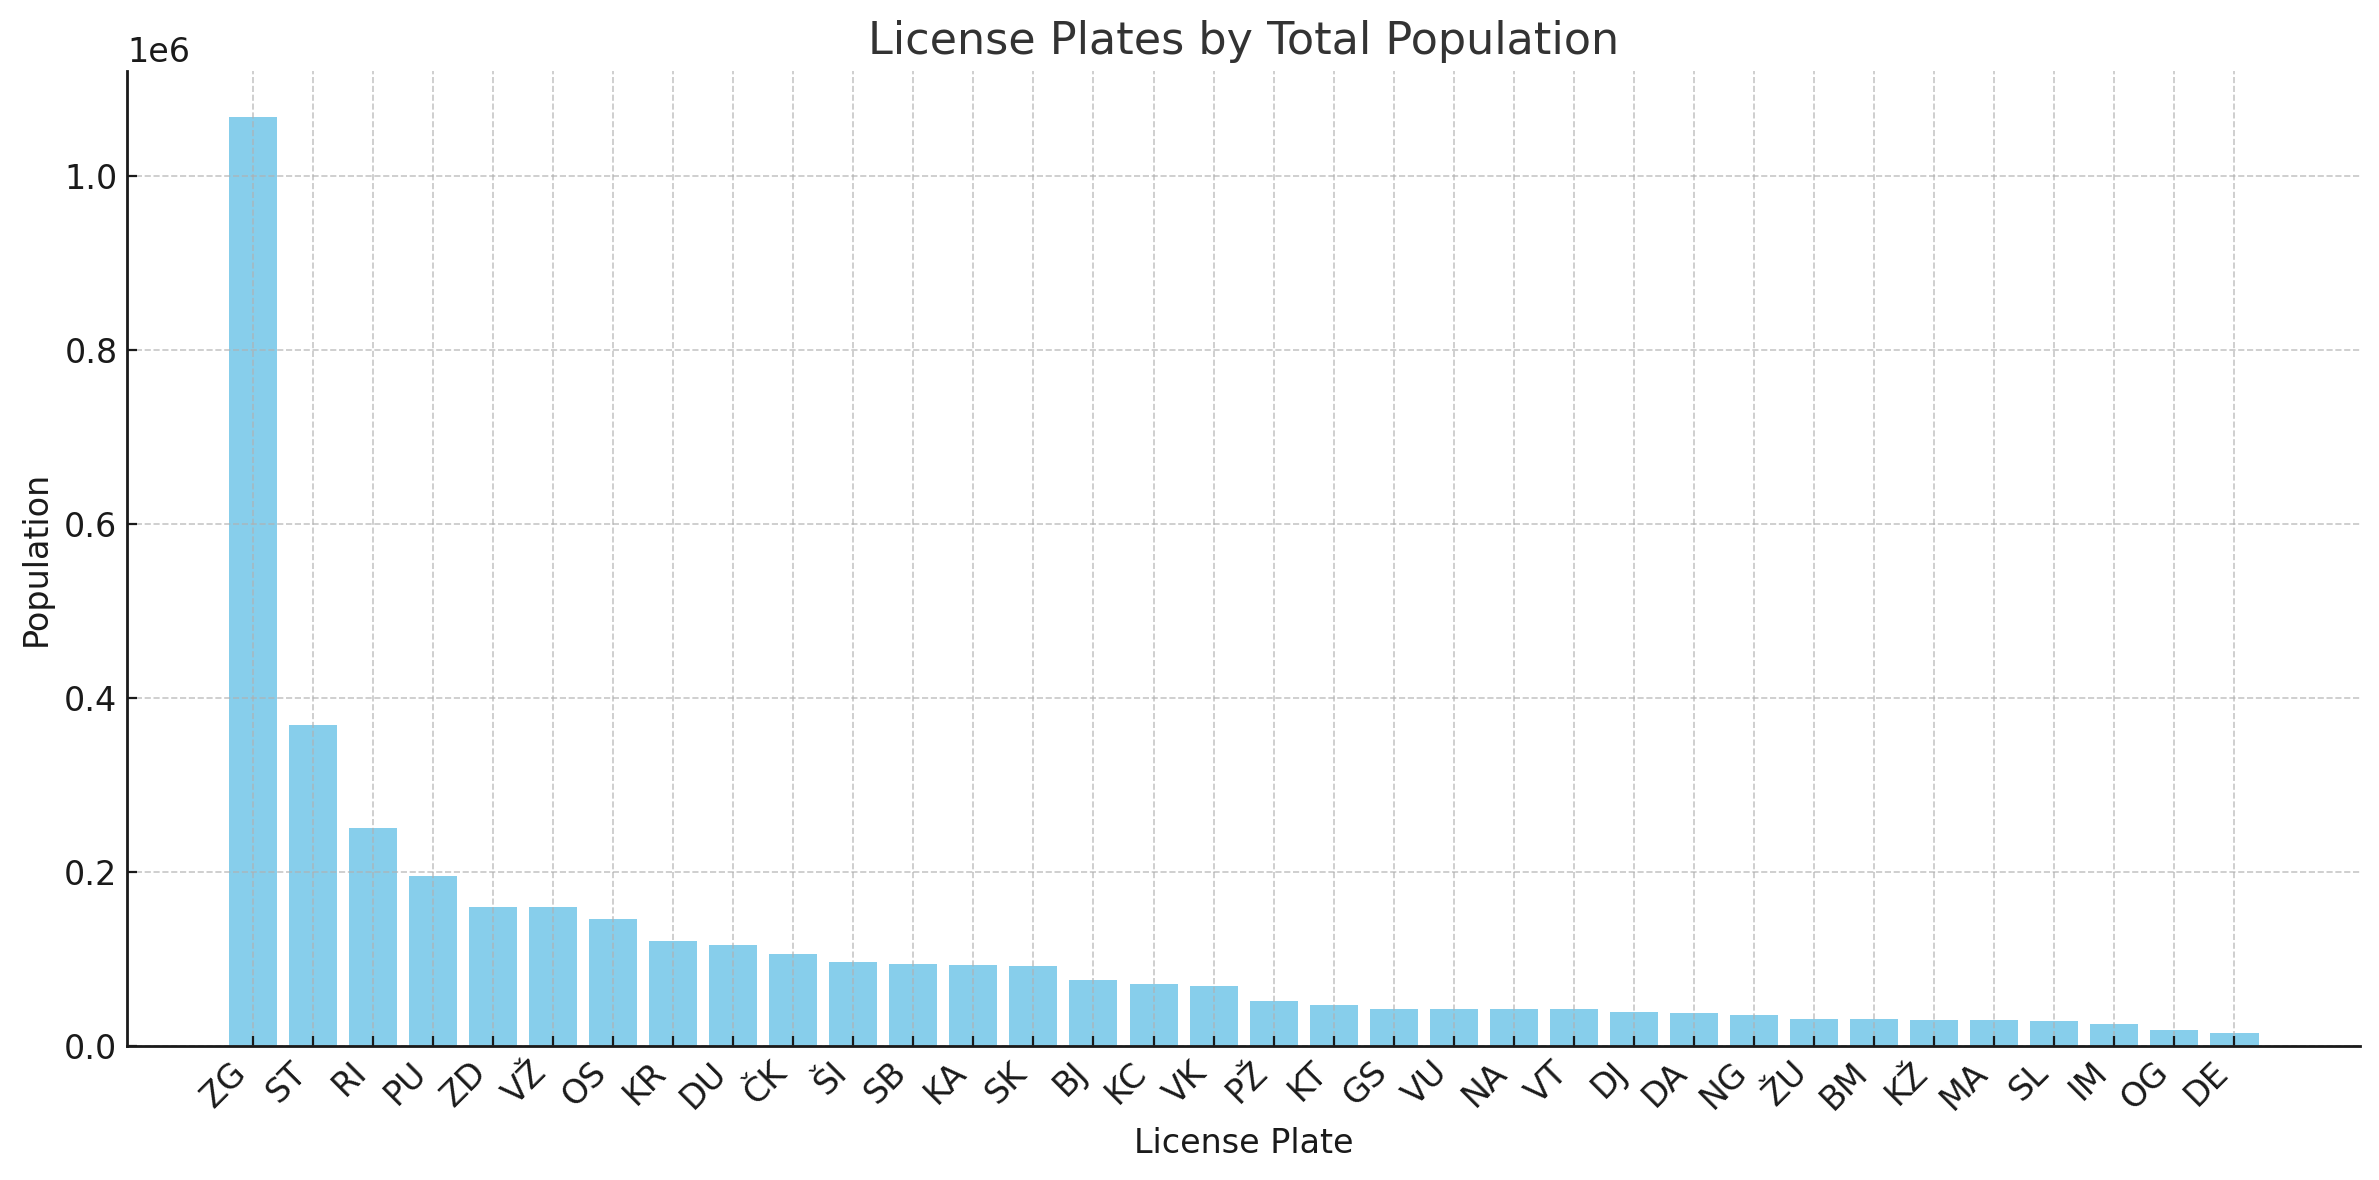
In this chart, we can see that the leader is the ZG code with 1,067,116 people, followed by ST (368,992), and RI (250,341). On the other end, DE is the smallest code with 15,078 people, followed by OG (18,783), and IM (24,747).
Percentage of license plate population coverage covered by the main town
This one is my favourite — dividing the main town population by the total population of the license plate, we get some interesting statistics:
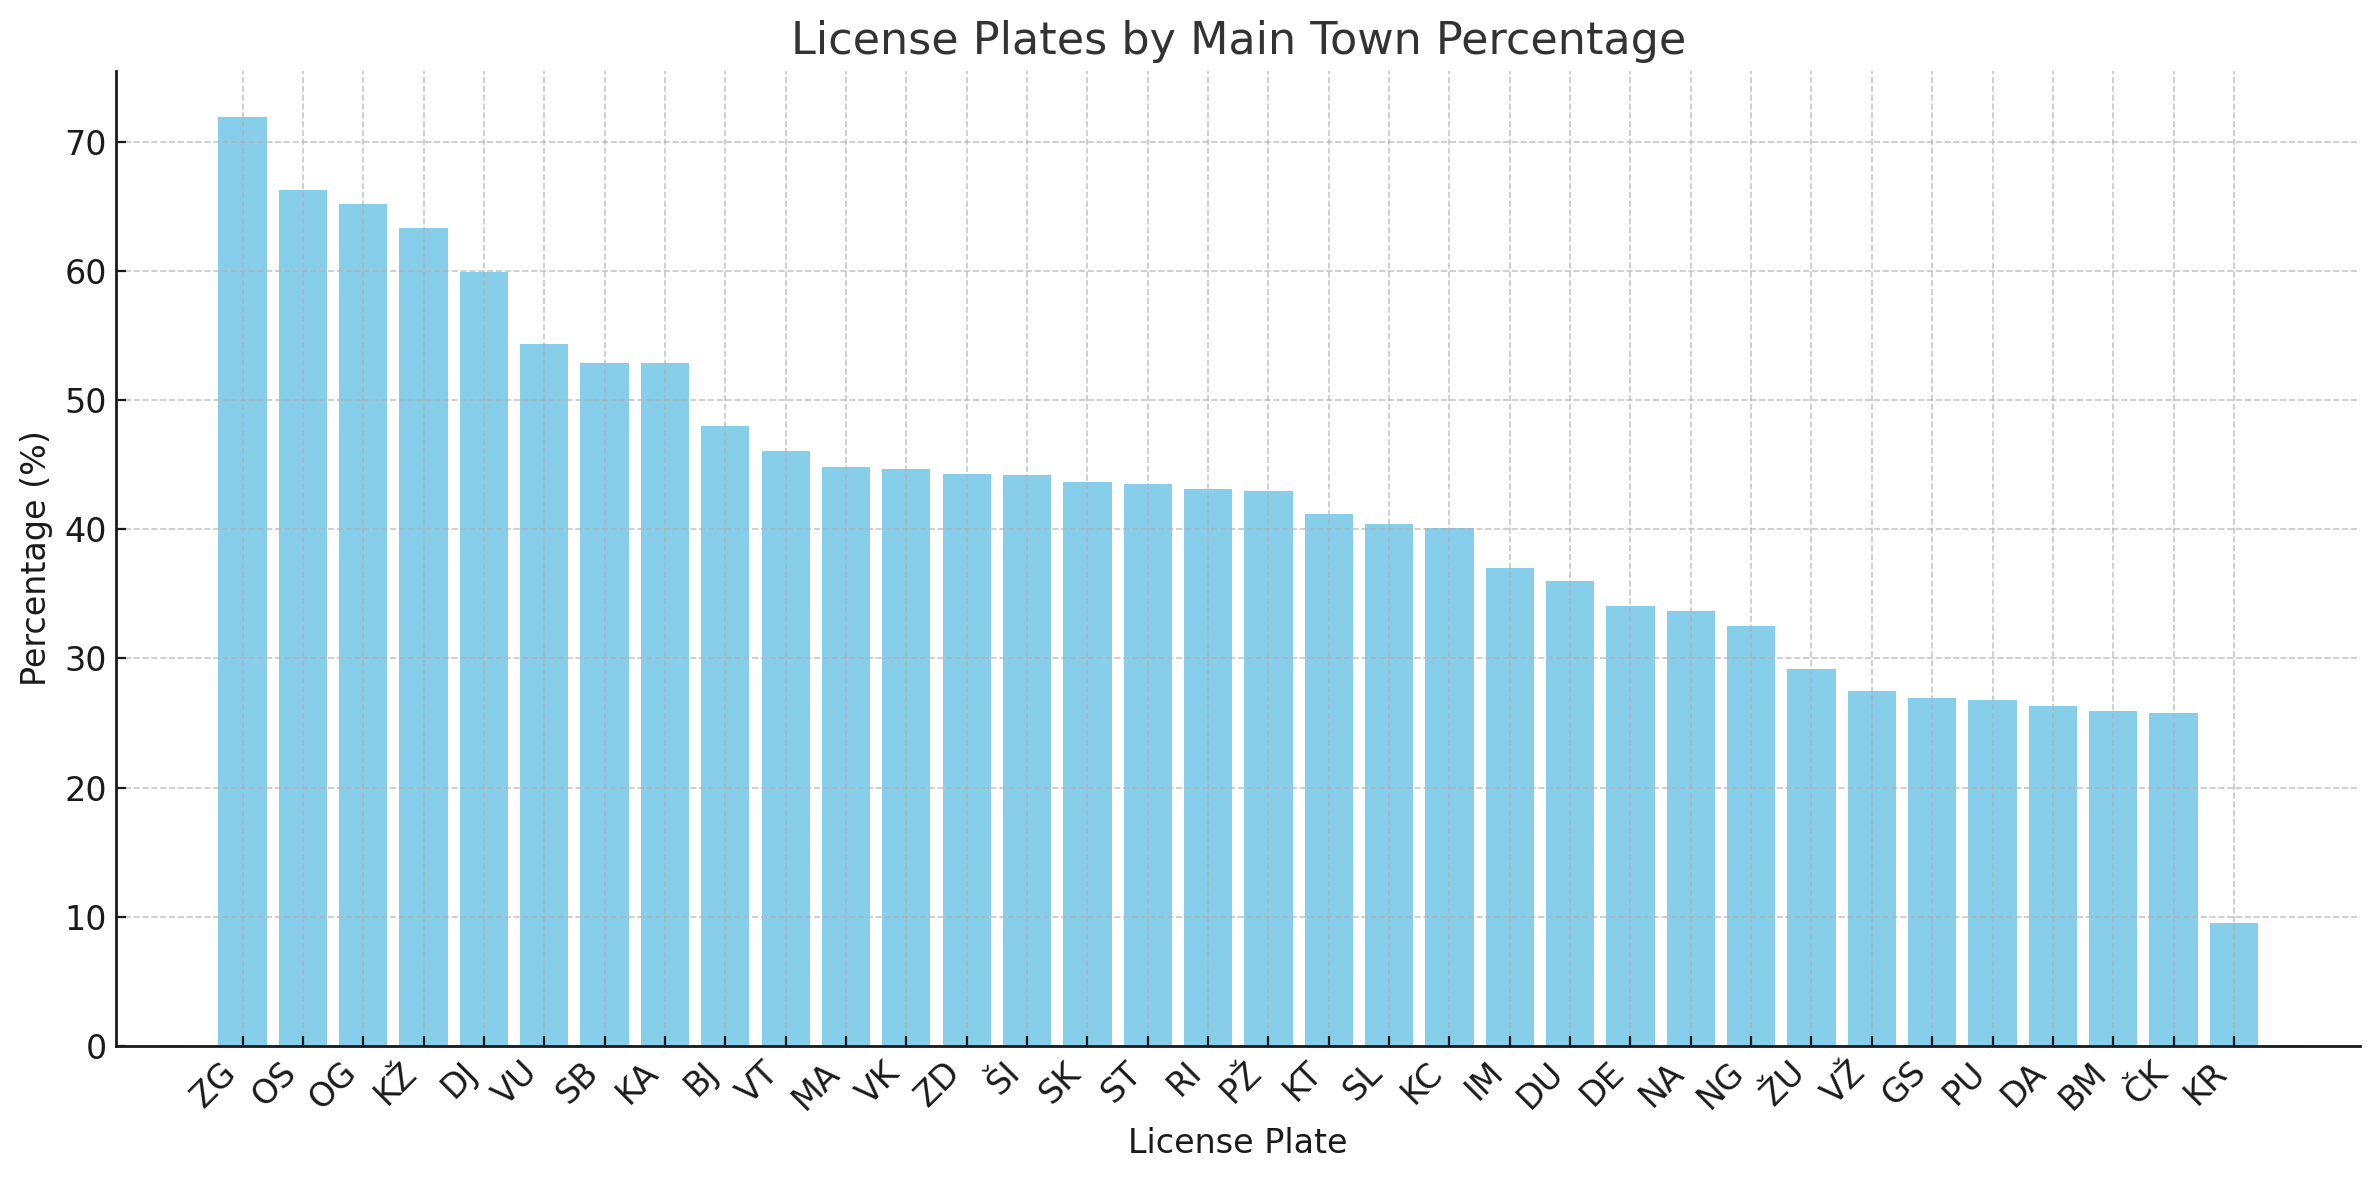
This means that 71.89% of people eligible for the ZG license plate live in Zagreb, but only 9.55% eligible for the KR license plate live in Krapina! Zagreb is huge compared to its neighbours, so it’s no surprise it has such a high percentage. Krapina, on the other hand, shares the town code with 6 towns of similar size and 25 municipalities.
License plates by number of towns and municipalities
This one is also interesting — by taking the sum of municipalities and towns array lengths, we get to see how “distributed” the code is:
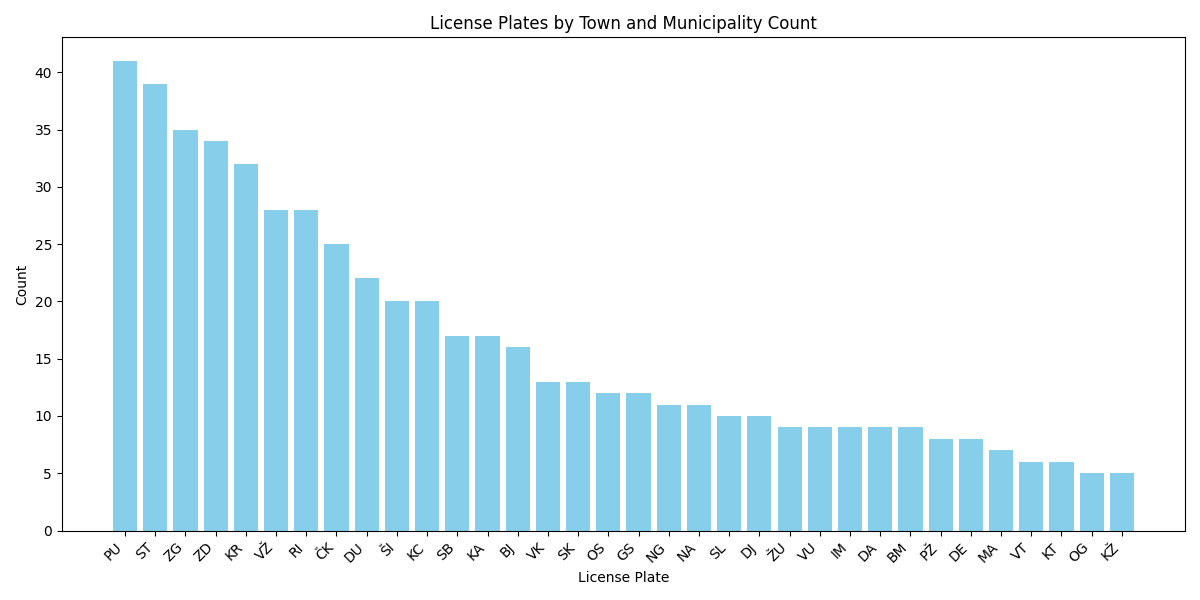
The PU code takes the lead with 41 towns and municipalities, followed by ST (39) and ZG (35). On the bottom, we have KŽ (5), OG (5), and KT (6).
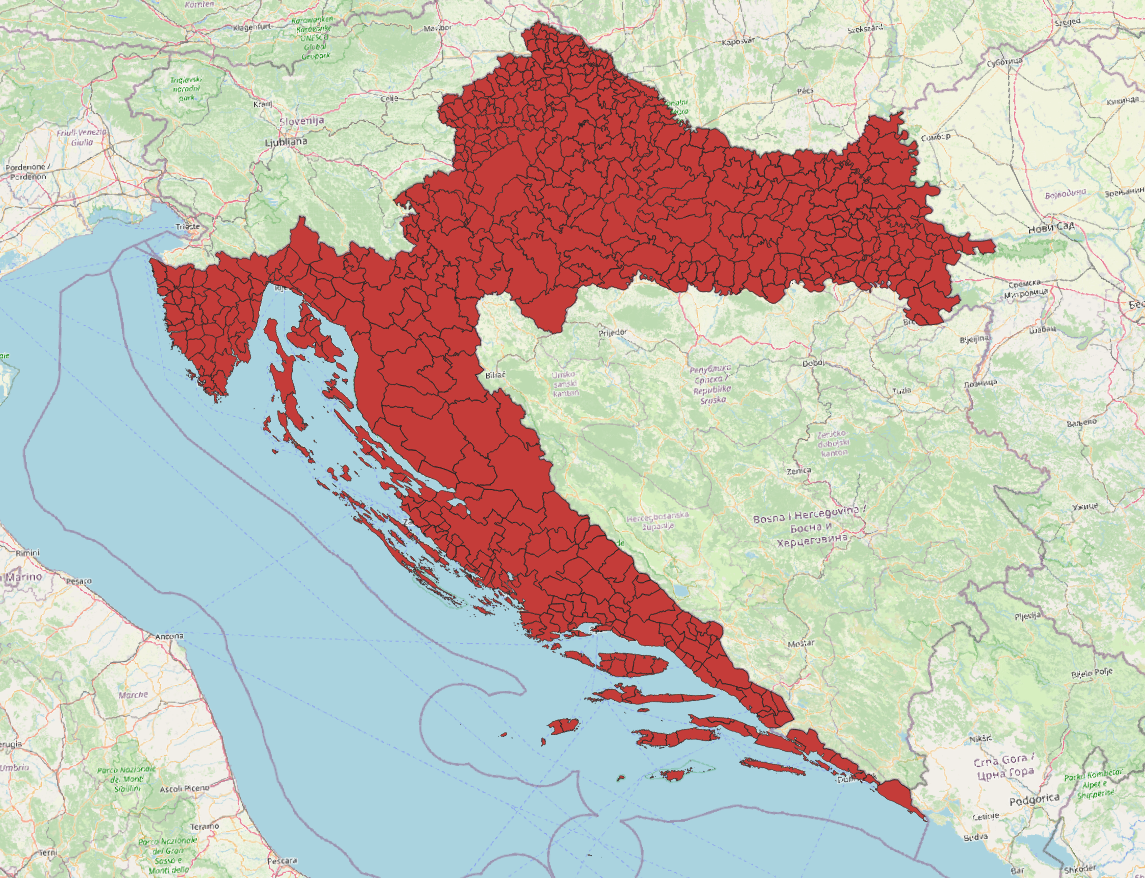
Let’s talk maps
This was all fun, but it didn’t provide me with a visual understanding of the distribution of the town codes. I wanted to see the shapes, the borders, the colors! So, as one does, I found this XML file which included a link to this ZIP file with the GIS data of all Croatian administrative units (country, counties, towns, municipalities, villages, etc). After a brief consultation with Chat GPT, I now considered myself an expert in QGIS, and I extracted the town and municipality data from this file.
After cleaning up the names of the towns and municipalities to match the names in other files (Title Case instead of UPPER CASE, removing Italian names, adding diacritics, etc.), I was able to add a plate property to each feature of the map. Then, using the Dissolve process in QGIS, I was able to join the towns and municipalities with the same license plate town code, and color them accordingly. Using the Centroids modifier, I created labels for each license plate area. This is the result:
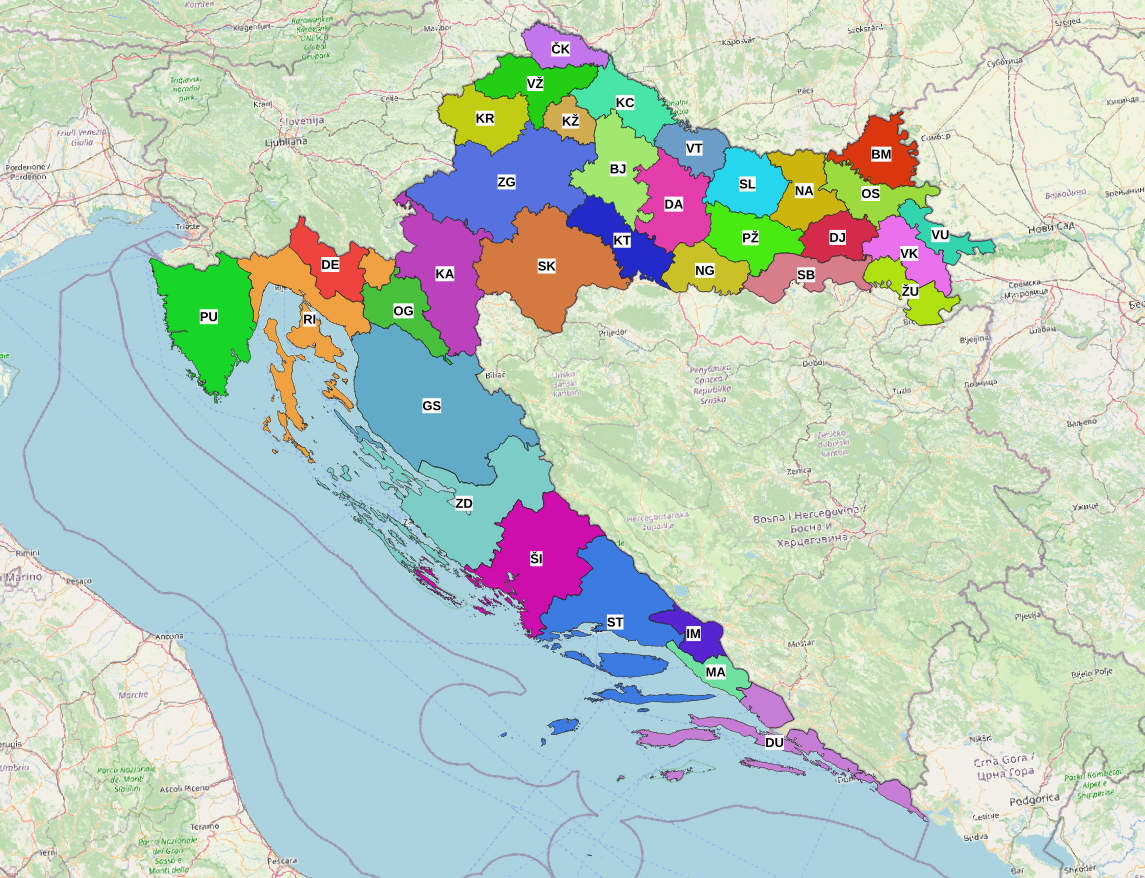
As you can see, some codes like ZG and GS cover huge areas, and others like IM and MA cover very small areas. We can also see that the RI code area is split in two parts by the DE and OG areas.
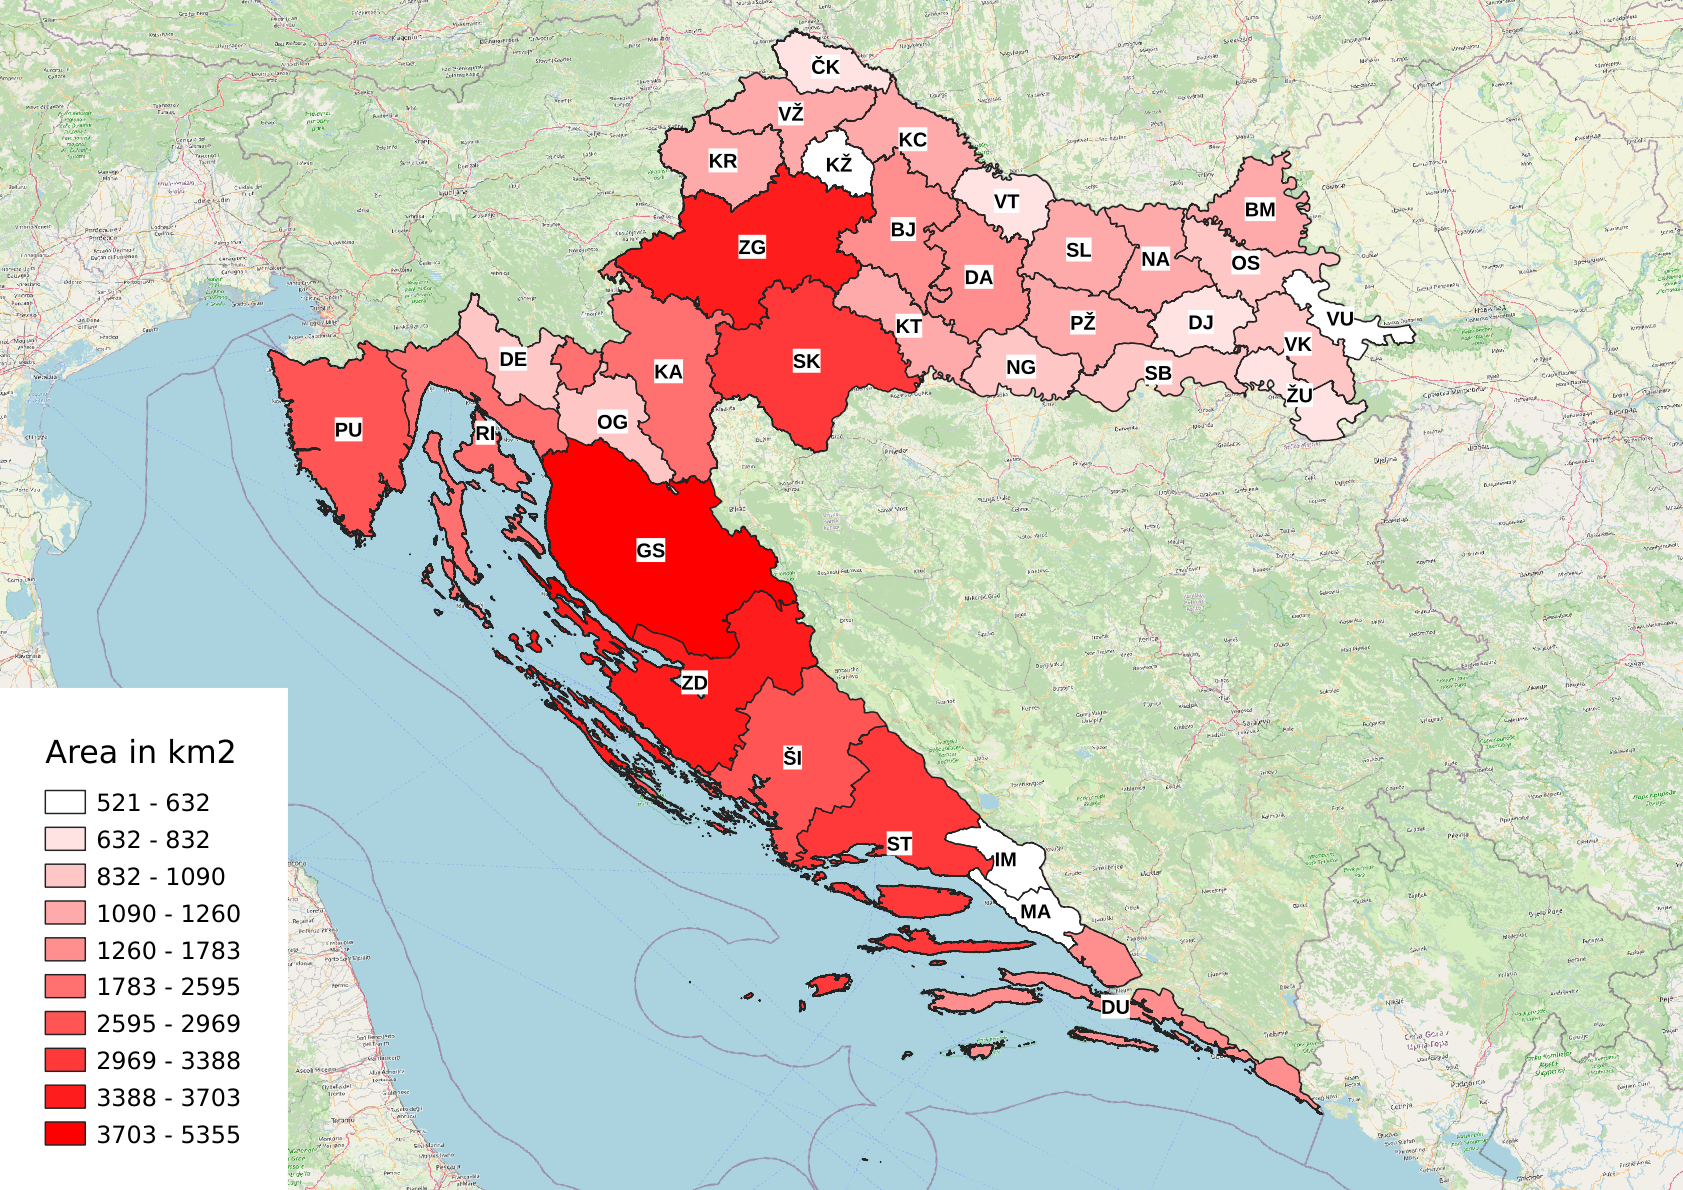
In QGIS, it’s fairly easy to add the area in square kilometers to the feature properties, so after doing that, we can show a heatmap with the area of each town code:
Similarly, we can create a heatmap with the population of each town code:
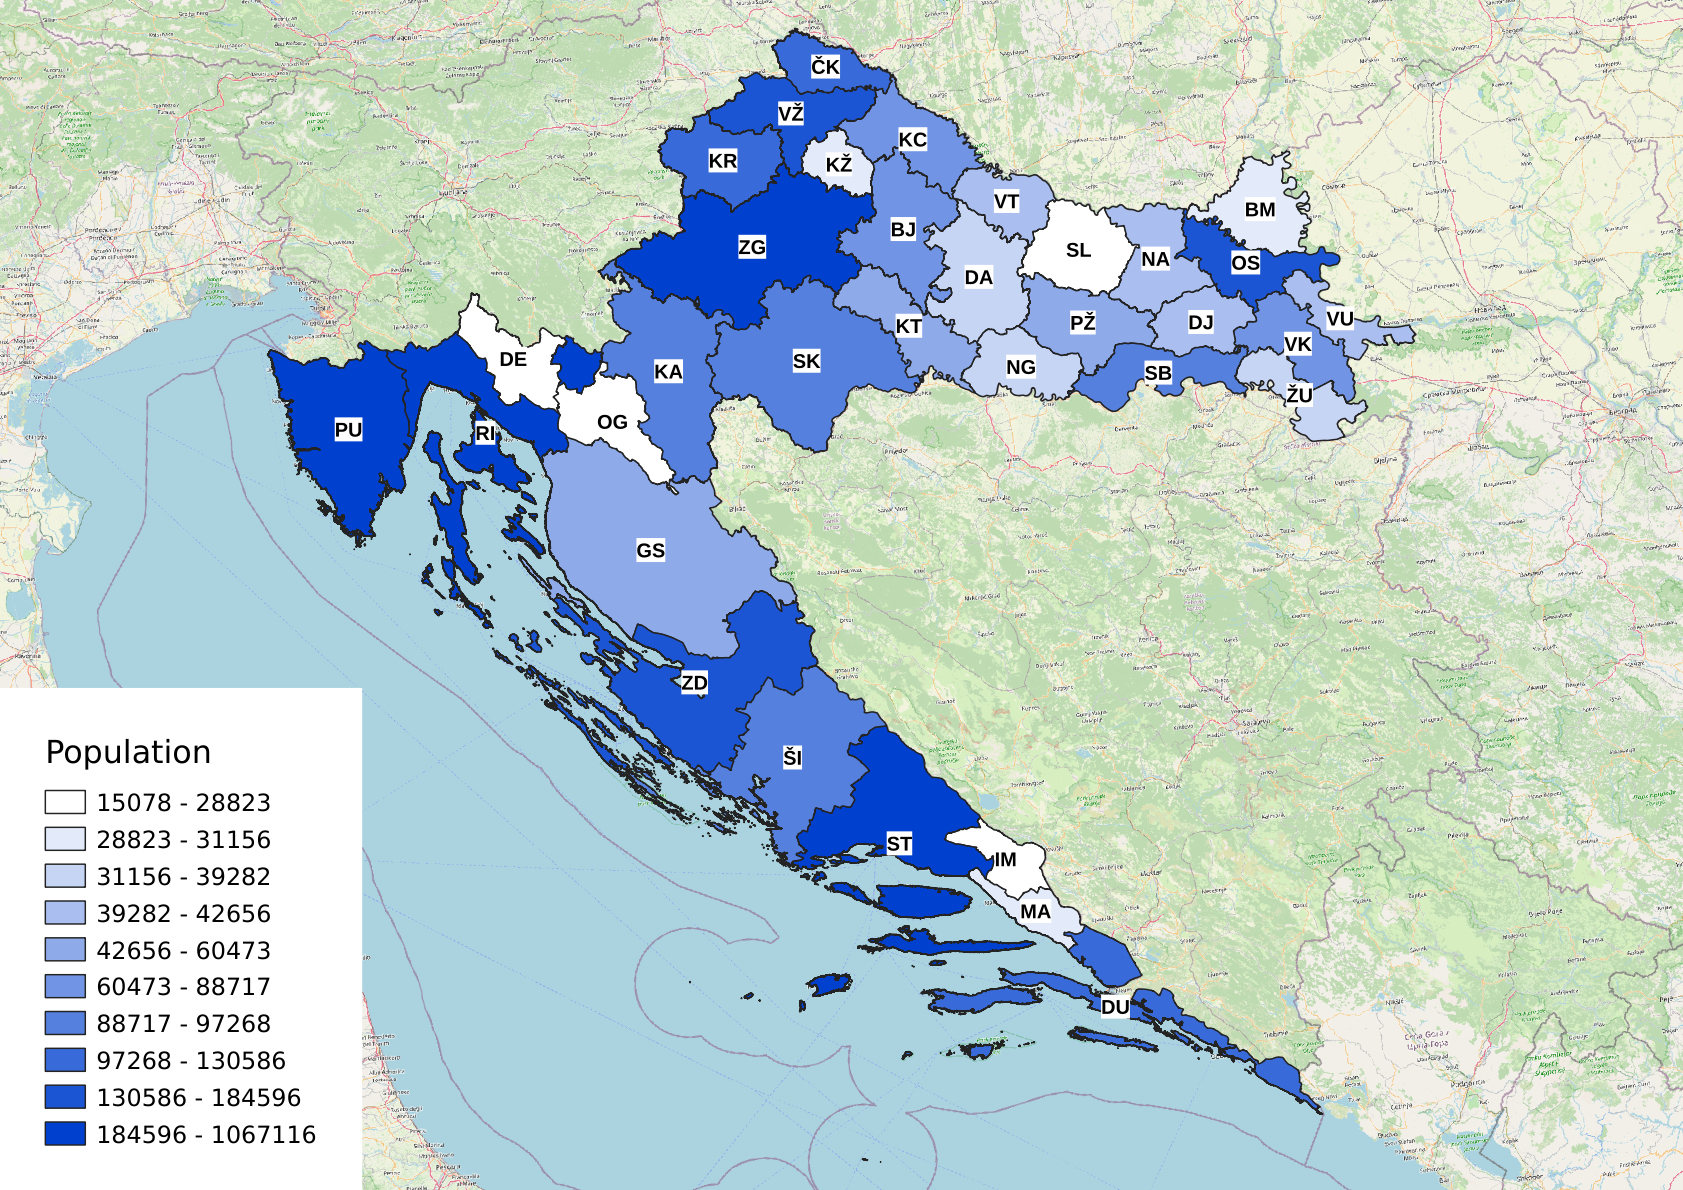
These maps provided me with much more insights than the raw numbers; for example, one might argue that the creation of the IM code was useless, because now both MA and IM have very small areas and very small populations.
A similar case could be made about DE and OG codes. As we already mentioned, the RI code area is split into two pieces by the DE and OG code areas. There is probably a better way to handle this, especially considering the low populations of the DE and OG areas.
One last map - Voronoi diagrams
I had one more fun idea — what would the map look like if we didn’t care about the municipality borders, but instead everyone registered their vehicle with the code of the nearest town? To find out what this would look like, we can use Voronoi diagrams. Voronoi diagrams are a way of partitioning an area into regions where each region contains all of the points that share the closest site of a finite set of points. In our case, the area is Croatia, and the finite set of points is the set of our main towns.
In QGIS, this is also fairly simple. We can find the centroids of each of our main towns with the Centroids process, then find the regions using the Voronoi polygons process, and finally clip the result to the polygons representing the borders of Croatia. Here’s the final result:
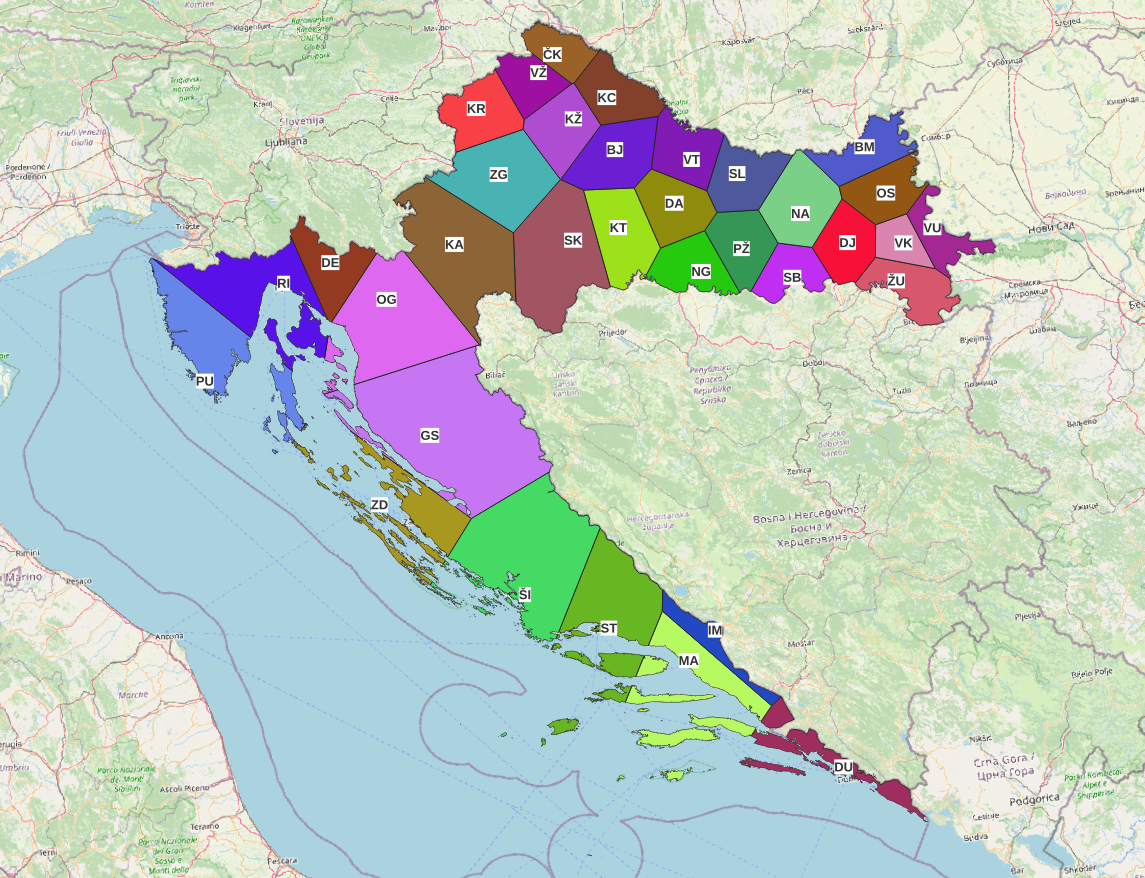
Although this way of dividing the town codes is probably not a good idea, it is fun to see the difference from the real map. The borders in continental Croatia didn’t move much, but the ones on the coast moved a lot.
Notes
There are a few important things to note:
- Population is probably not a good measure for the usefulness of a license plate town code. A better measure would be the number of registered cars per year, per town code. However, I could not find this data; I could only find the data for the entire country.
- In 2015, there was an attempt to have all 128 towns have their own town codes, but after a lot of disagreement from different towns, it ultimately failed, and the same system was kept.
Sources
All of the code, some data, and some visualizations are available in this repository. Note that the map files (GeoJSON, QGZ, GML) are quite large, so they won’t be available until I find a simple way to host them.
- Car plate data was taken from this Wikipedia article and its sources
- Census data was taken from here
- Map data was taken from DGU — I had to really dig through some of these XML to find the data… It has all of the data I needed, but it’s not structured very well.
- Unfortunately, since I was using jq in the terminal for some of the data manipulations, I didn’t save everything, so some scripts may be missing from the repository.
- I used QGIS for the maps.